WhakamĀrama Āpitihanga
He tūtohi tēnei e whakaatu ana i ngā tāone o Aotearoa kei waenga i te 20,000 me te 100,000 te taupori:
Te taupori o ētahi tāone o Aotearoa
| Te tāone | Te taupori |
| Te Waiharakeke | 25,875 |
| Tūranganui-a-Kiwa | 32,653 |
| Heretaunga | 58,575 |
| Te Waihōpai | 49,306 |
| Kapiti | 30,004 |
| Whakatū | 52,348 |
| Ngāmotu | 49,079 |
| Papaioea | 73,862 |
| Rotorua | 56,928 |
| Tauranga | 82,832 |
| Te Tihi o Maru | 27,521 |
| Whanganui | 41,320 |
| Whangārei | 45,785 |
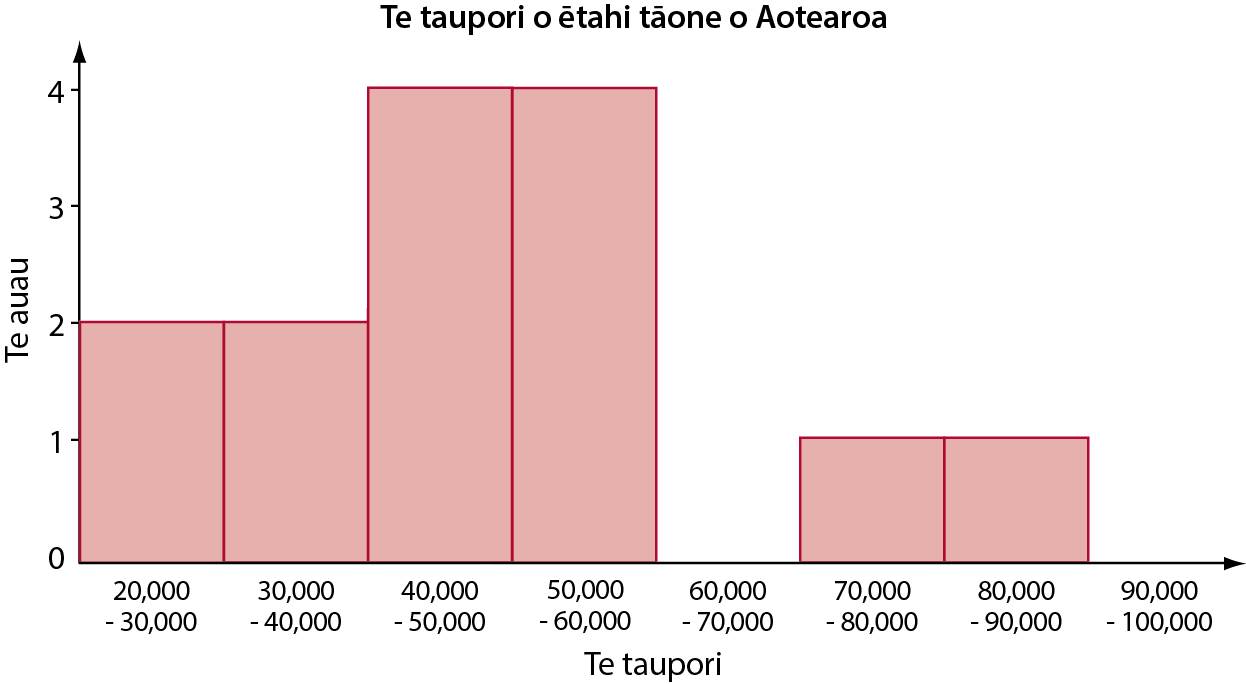
E taea ana ēnei raraunga te whakaatu ki te tūtohi auau. Ka whakarōpūhia ngā taupori kia ōrite ai te whānui o ia rōpū:
Te taupori o ētahi tāone o Aotearoa
| Te rōpū taupori | Te maha o ngā tāone kei ia rōpū |
| 20,000 - 30,000 | 2 |
| 30,000 - 40,000 | 2 |
| 40,000 - 50,000 | 4 |
| 50,000 - 60,000 | 4 |
| 60,000 - 70,000 | 0 |
| 70,000 - 80,000 | 1 |
| 80,000 - 90,000 | 1 |
| 90,000 - 100,000 | 0 |
Nā te mea e hono ana ia rōpū raraunga (arā, he raraunga motukore), e tika ana kia whakaaturia ki te kauwhata pouhere: